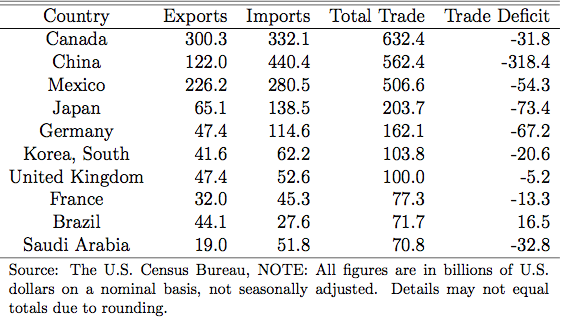
The U.S. Census Bureau have reported the fact that gross export of goods only was $1,579 billion and gross imports was $2,268 billion in 2013. We can obtain a decomposition of this trade balance by all the trading partners. The U.S. has the highest total trade ($632 billion) with Canada but the most trade deficit ($318 billion) with China. The following Table 1 exhibits the statistics of the U.S. top 10 trading partners. All the bilateral trade statistics of the U.S. like the table below are not usually based on value-added but the gross value.
Why does the trade balance from each county based on the gross value matter? Because it gives us inaccurate information owing to double counting in each gross value, the most trade deficit from China can be overestimated . In order to shed light on the real trade pattern between the U.S. and China, it is necessary to illuminate the trade among East Asian countries because of the gross value problem.
Today, the international trade relationships among global economy gets more complicated as the level of interdependence of all countries gets higher. For example, the economic relationship between the U.S. and the East Asian countries are getting closer especially in manufacturing sectors. Suppose a Korean company operating factories in China produces smartphones to export to the U.S. and a lot of electronic parts in the smartphones are actually imported from Japan. This would suggest the smartphones are considered as the export from China but it does not show the fact that most parts are from Japan. This example can be called “Vertical Specialization.” More recently, global economies are so integrated that goods and services cross their borders very often. In many cases, China imports a lot of intermediate goods from Japan and South Korea in order to produce the final products and then export to the U.S., or the rest of the world. Moreover, it is necessary to see not only Chinese economy, itself but its behind scene, which has complicated relationship among East Asian countries, especially Japan and South Korea.
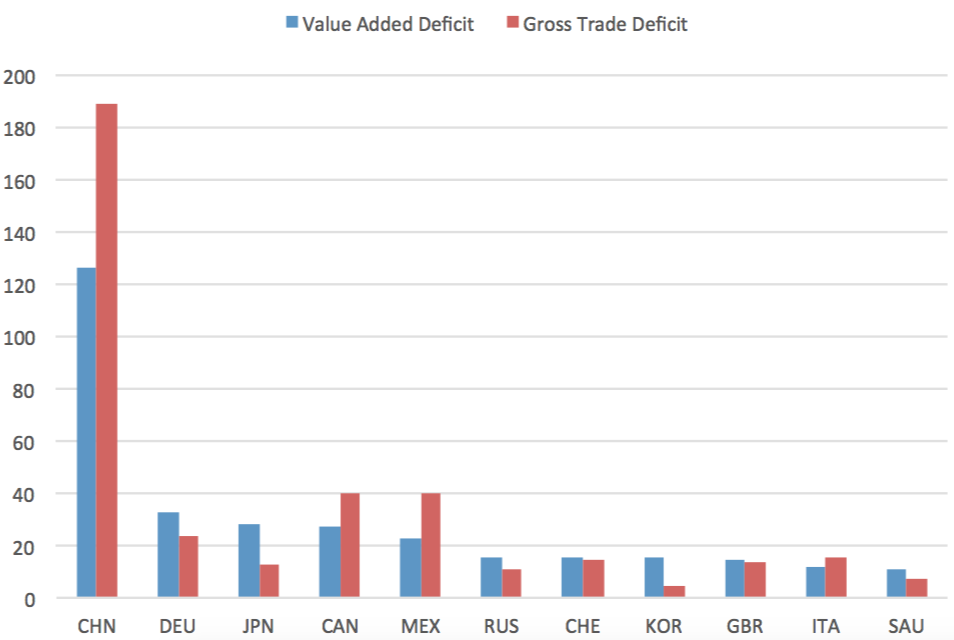
The trade balance data cannot capture those cases, relating the role of third countries in bilateral trade. However, value-added trade data can uncover those cases even though data availability is very limited. It is recent for the OECD and the WTO to undertake this joint work of value-added trade data. The following Figure 1 shows the difference in the U.S. bilateral trade balances between value-added deficit and gross trade deficit by using the OECD-WTO TiVA database.
In the OECD-WTO database, the domestic value added and intermediate imports were already taken care of to measure the U.S. Bilateral trade balances. As we can see in the Figure 1, the U.S. trade deficit in terms of the value added was smaller in China, NAFTA partners, and Italy but larger in Germany, Japan, South Korea and other EU countries.
We can explain these differences between gross and value-added trade as follows. The gross exports consist of three elements: domestic value-added that remains in foreign countries; domestic value-added that returns home; and foreign value-added in the exports. In the same manner, the gross imports also consist of three elements: the foreign value-added stays in the country; the foreign value-added in imports which are exported again later; and domestic value-added in its imports. However, a value-added export only counts the domestic value-added that remains in the foreign country and value-added imports do the foreign value-added that stays in the foreign country.
Figure 1: Bilateral Trade Balances

Theoretically, a country’s trade balance should be the same in terms of gross or value-added terms because domestic and foreign value-added over all the countries cancel each other out over a total trade. However, bilateral trade balances can be different dramatically as we can see the figure above. Differences between gross and value-added bilateral trade give us important lessons for not only theoretical perspectives but trade policy implication perspectives.
How does the pattern of trade among East Asian countries looks like? In order to apply the value-added method, we can find the facts that trade pattern between China and South Korea was dominant in intermediate goods, and that they have high dependency of parts and basic materials on Japan. They show sufficient conditions for China and South Korea to invest on parts and basic materials as well as for them to diversify their trading partners in the long run.
